In response to several requests, the deadline for uploading a scientific posters or art & biology submission has been extended to June 4, 23:59 PST. To find the upload link, please see the email sent to you confirming your registration.


In response to several requests, the deadline for uploading a scientific posters or art & biology submission has been extended to June 4, 23:59 PST. To find the upload link, please see the email sent to you confirming your registration.
Eric Lander, the president and founding director of the Broad Institute of MIT and Harvard gave the opening remarks for VIZBI 2011. He presented a compelling case for why a focus on data visualization is urgently needed in modern biological research and education. A video of Eric’s opening speech can be viewed here.

Visualization is increasingly important in life science as data grows rapidly in volume and complexity. The VIZBI initiative is an international conference series started in 2010 which took place alternating in Europe and the USA. On our 8th year, VIZBI will be staged in Australia for the first time, each meeting has had outstanding feedback from attendees, and the most recent (VIZBI 2016) was featured in a Nature News article. To get a flavor of what happens at a VIZBI conference, watch this video from a previous VIZBI (2014) meeting.

This tutorial will be presented by Lars Juhl Jensen and Jessica Xin Hu (Tuesday, 13 June, 2:00 pm – 5:00 pm), they will discuss the fundamentals of the Cytoscape network visualization tool and the STRING database, which integrates known and predicted protein associations from a variety of evidence types. Participants will be able to interpret protein associations correctly and understand the uses of Cytoscape and its STRING App.

It is now recognized that the skills of data storytelling and narrative development are becoming as crucial as statistical analysis and data analytics. In this tutorial, Paul Hodge will take you on a journey through entertaining and informative examples of world-class Data Visualisations, its frameworks and how to build a compelling Data Visualizations that will engage, entertain and inspire future decision makers (Tuesday, 13 June, 2:00 pm – 5:00 pm).

Epiviz is an interactive visualization tool for functional genomics data. It supports genome navigation like other genome browsers but allows multiple linked visualizations of data within genomic regions using scatterplots, heatmaps, and other user-supplied visualizations. It has a close connection to the R/Bioconductor genomics data analysis platform for flexible computational and visual exploratory analysis. Hector Corrado-Brava will introduce to students -the use of Epiviz for exploratory analysis of data using interactive visualization and computation (Tuesday, 13 June, 9:30 am – 12:30 am).

Poster upload for VIZBI 2017 is closing on 23:59 PST on 31 May 2017. Immediately after uploading, you will be able to preview a zoomable version of your poster, showing how it will appear on the VIZBI poster pages. Click here for more details.

The analysis of AFM data from biological samples can be intimidating and unwieldy. In this tutorial, Siobhan Braybrook will discuss experimental design considerations based on example biological questions, data analysis models and quality control metrics. She will also cover how the returned results relate to the biological sample in question (Tuesday, 13 June, 2:00 pm – 5:00 pm).

There is a growing need for effective visualizations of complex data structures which combine scientific thinking, statistical analyses, and successful storytelling. In this tutorial, Nenad Bartonicek (Garvan Institute, Sydney) leads you through the process of decision-making, data transformation and effective communication of graphs in R (Tuesday, 13 June, 9:30 am -12:30 pm).

We are pleased to announce that – as with previous years – Autodesk have agreed to sponsor a prize for the most visually compelling and original ‘Art & Biology’ submission. Each VIZBI participant is invited to upload one artistically-inspired image, which will be featured on the VIZBI poster gallery. The award winner will receive a one-year subscription to Autodesk Maya (valued at $1,825 CAD). Maya is widely-used for creating interactive 3D applications, video games, animated film, TV series, and visual effects. The prize is offered to participants from academics and industry alike, but cannot be resold. The Art & Biology entries will be unveiled during the Art & Biology evening on Thursday, June 15, and the winner will be announced on June 16 during the closing session. For details see the VIZBI 2017 poster page. The deadline for upload is May 31 at 23:59 CET.

Tamara Munzner will be a keynote speaker at VIZBI 2017 (Sydney, 14-16 June); she has worked on visualization projects in a broad range of application domains, including genomics, evolutionary biology, geometric topology, computational linguistics, large-scale system administration, web log analysis, and journalism.
Tamara was also a keynote speaker at VIZBI 2011 (Broad Institute of MIT & Harvard, USA), where she presented lucid and very useful guidelines for creating effective visualizations. She highlighted the advantages of 2D representation – compared with 3D, immersive, or animated visualizations – and described methods to reduce the viewer’s cognitive load, and to validate visualizations. A video of Tamara’s 2011 keynote can be viewed here.

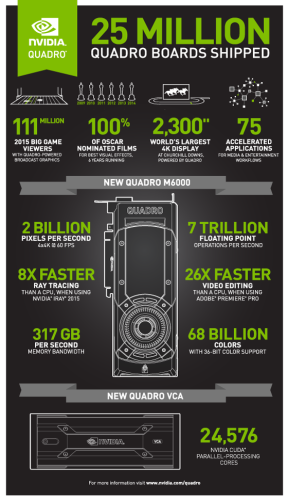 We are pleased to announce that – as with previous years – NVIDIA have agreed to sponsor a generous prize for the poster that best exemplifies the use of data visualization to gain clear, compelling insight into an important scientific problem. The award winner will receive a Quadro M6000 card, one of the world’s most powerful GPUs, making real-time photorealistic rendering possible for even complex scenes. It can drive up to four 4K displays simultaneously, and its 3,072 CUDA cores make it perfect for many scientific applications. To upload your poster, use the submission link in your VIZBI registration email. Accepted posters will be published in the VIZBI poster gallery. The deadline for upload is May 31 at 23:59 CET.
Drew Berry will be a keynote speaker at VIZBI 2017 (Sydney, 14-16 June); his animations have received international recognitions including an Emmy (2005) in the category of Outstanding Science, Technology and Nature Programming for the episode, ‘The Human Race’, and a BAFTA award (2004). He was trained as a cell biologist and microscopist, and brings a rigorous scientific approach to each project, immersing himself in relevant research to ensure his animations include up-to-date data.
He was also a keynote speaker at VIZBI 2011 (Broad Institute of MIT & Harvard, USA), where he presented spectacular highlights from his videos on the malaria life cycle at the cellular scale, on DNA replication, and on the human brain at the tissue, cell, and molecular scale. A video of Drew’s 2011 keynote can be viewed here.

In case you missed it: VIZBI 2016 (in Heidelberg, Germany) was featured in a Nature News article that examined how the right visualization can transform a biologists’ understanding of their data. Read the full article here.

With seven tutorials plus the Data Visualization Masterclass, you are spoilt for choice:
Morning:
Afternoon:
All-day:
Also happening in Sydney – one day prior to VIZBI – is SBRS, a free one-day symposium at the University of Sydney (Tuesday, 13 June 2017). SBRS features two excellent international speakers, Professor Liran Carmel from Israel and Professor Geoff Barton from the UK. There are plenty of spots for oral presentation, fast-forward presentations, and poster presentations – with several prizes to win. To encourage participants from regional NSW and ACT, this year SBRS will offer a number of travel bursaries (up to $500 each) to SBRS abstract submitters who reside in regional NSW and ACT. The vision is to make SBRS a truly state-wide event for the benefit of all researchers, partitioners, and students in the field of bioinformatics and computational biology. For more information about SBRS, and to submit an abstract of your work, go to http://www.abacbs.org/sbrs2017. The abstract submission deadline is 22 May 2017.
